It has been another busy month for Upwave, adding new features at the request of our customers! You ask and we really do listen.
You’ve now got access to self-serve tag management for tagging data whenever you need it; we’ve updated the Upwave dashboard, so you can export both Brand Lift and Targeting Verification tables for use in presentations, emails, and more; and you can now select as many KPIs and cuts as needed when creating a tabular visualization—perfect for comparing multiple aspects of your campaigns, simultaneously.
And now a bit more about each of these new features…
Automated Tag Management
Accurate and timely tagging is key to effective campaign measurement. Over thousands of Upwave-measured campaigns, we’ve listened to our customers share their appetite for greater visibility, more efficiency and quicker turnarounds when it comes to tagging—often under unforgiving timelines.
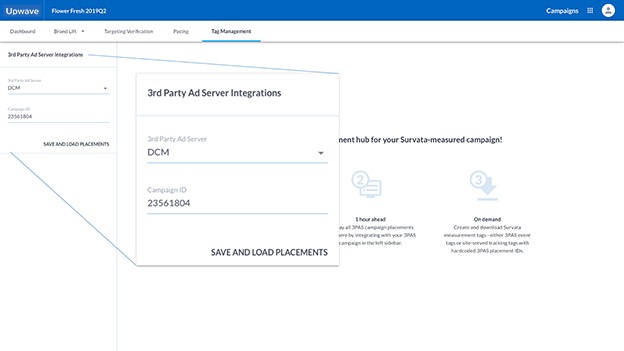
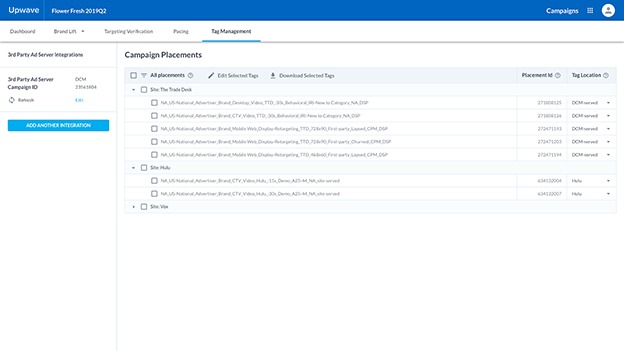
Upwave is excited to start bringing on-demand, real-time benefits to campaign measurement tagging with our new Tag Management dashboard. We’ve built a seamless, powerful integration with DCM (now known as GCM) via API. Simply enter your DCM campaign ID to retrieve placements over a secure, read-only connection that you control.

Based on these DCM placements, Upwave can generate DCM-served and site-served measurement tags with speed and ease. What’s more, Upwave can detect when additional tactics go live so you can ensure all your media is measured!

This functionality will be rolled out in phases over the coming weeks, but you can set up your DCM integration and view your placement-level media plan now. Ask your Upwave customer success team about setting up your DCM API integration today, and stay tuned for more exciting news on this front…
Export Your Brand Lift and Targeting Verification Tables
Many Upwave customers want to use visualizations from their Upwave dashboard in presentations and shareable materials. With our latest release, you can now export both Brand Lift and Targeting Verification tables as .png and .xlsx files, making them easy to include in a presentation, or to attach in email.
You can access both new export options from the speed dial menu in the bottom-right-hand corner of your Table Builder screen:
No Limits on Tabular Visualizations
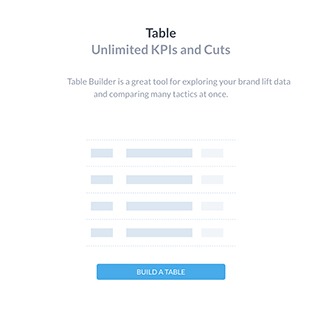
We received requests from many customers to remove the KPI limits from our Brand Lift table visualizations. With the latest release, we implemented new scrolling functionality that allows you to select as many KPIs and Cuts as you’d like when creating tabular visualization. The new unlimited capabilities of the Table Builder are perfect for comparing across multiple aspects of your campaign, simultaneously.

Find out more about these new or updated features, or request a demo of the Upwave platform.
