Over the past few months here at Upwave we have been releasing new features to better support our clients to make the most out of every study ran and gain true insights. We are excited about a number of the features you will start to see in the coming months including advanced variables, and custom reporting.
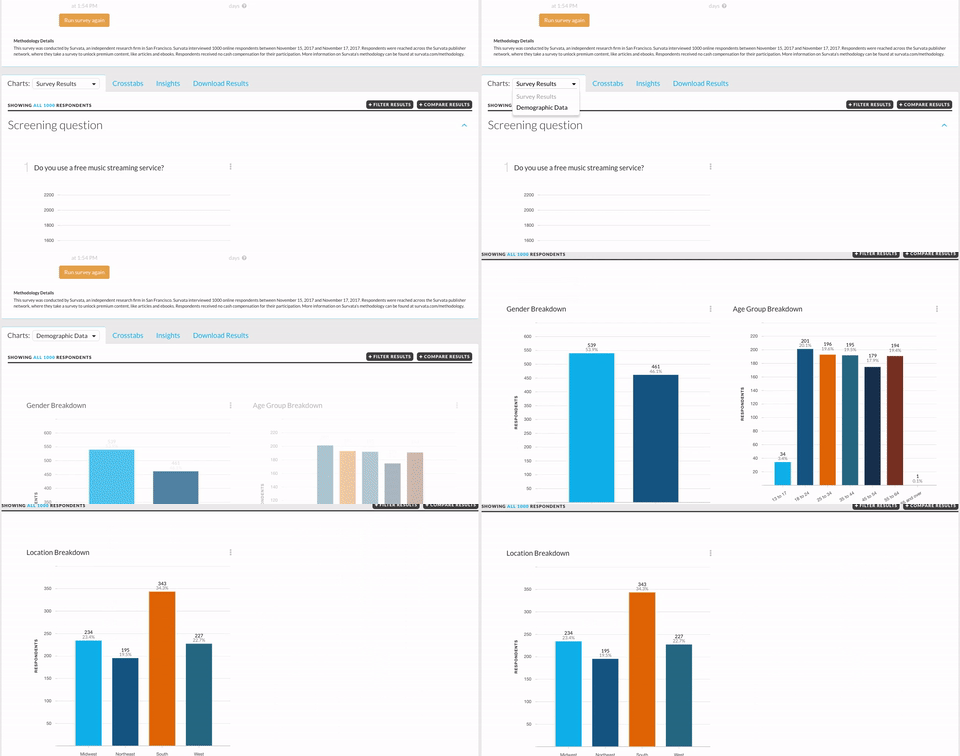
Get a quick look at your demographic data
Sometimes you need the most basic breakdown of you respondents to best understand and analyze your study. To get a quick look at the breakdown of gender, age and location simply navigate to demographic data in your charts dropdown.

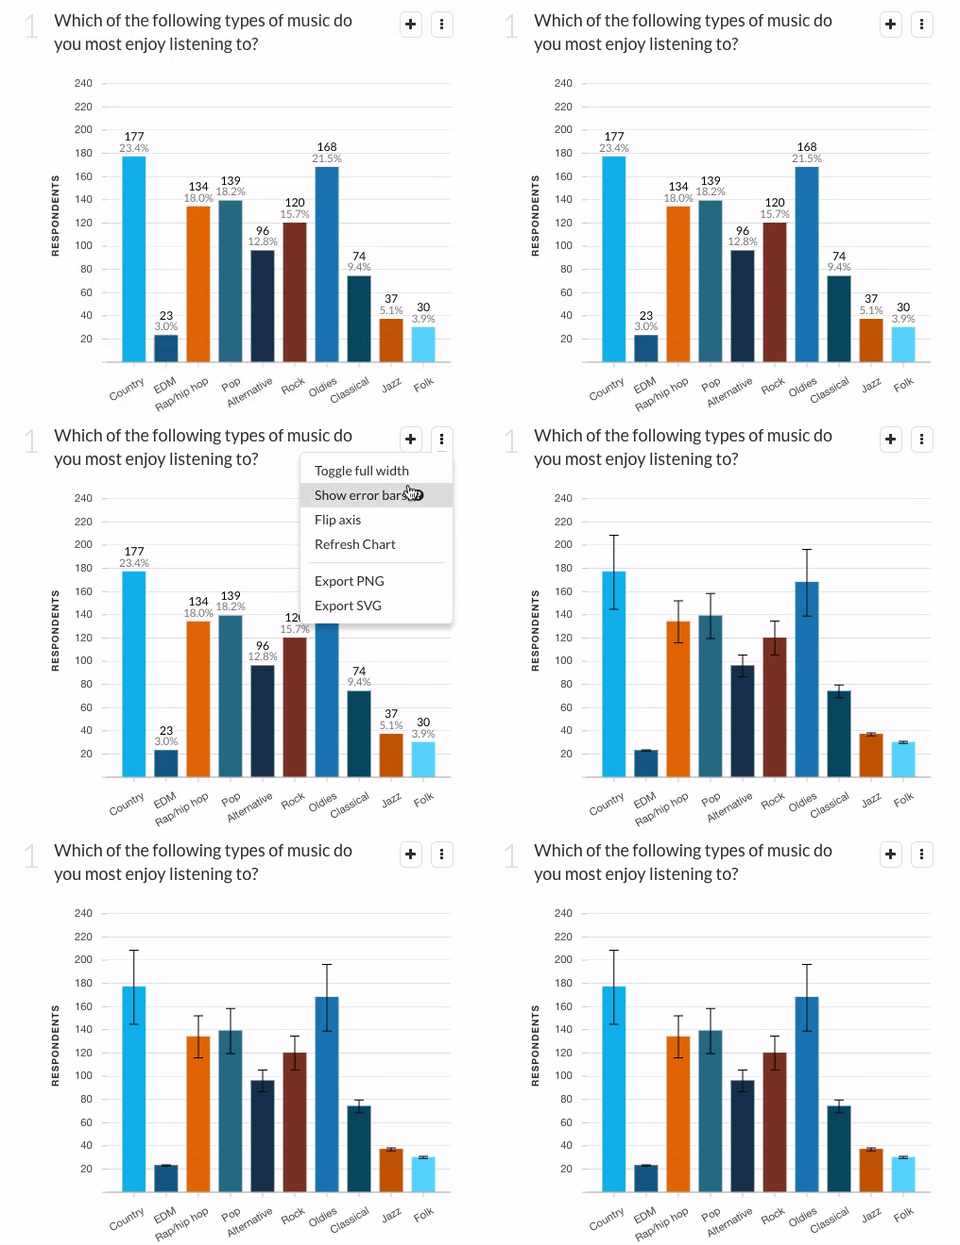
Use error bars to feel more confident in your results
You can now modify your charts to include error bars. Error bars add value by displaying the margin of error to help give you a better idea of how your results compare to the larger population. To take advantage of this new feature, when viewing a chart, select the top right corner – show error bars.

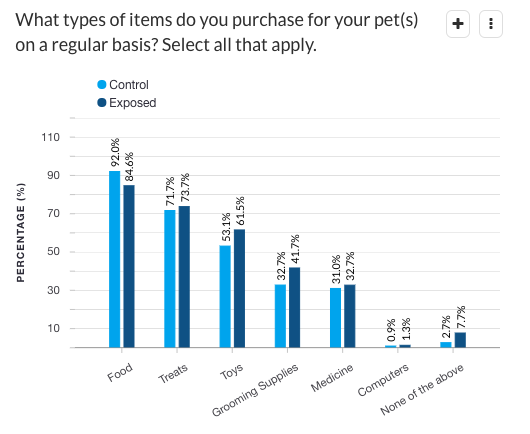
Get more out of your ad effectiveness studies
Clients running ad effectiveness studies can now log in and see their results compared by control and exposed. This allows you to get quicker insight into the pulse of your study without having to take any additional steps. We are continuing to bring product enhancements to our ad effectiveness studies through automated statistical analysis and layering of data sources.

