Nearly every aspect of brand lift marketing is dynamic, from the media plan to the data on impressions and outcomes collected continuously throughout a campaign. Yet when it comes to brand lift optimization decisions, the industry still relies heavily on measurement tools like statistical significance, p-values, and observed lift that are by design more static.
Statistical significance – as we explored recently – is intended to only be evaluated once or twice during a campaign. When statistical significance is evaluated repeatedly in a dynamic environment, the chances that at least one of the statistical significance determinations will be a false positive or a false negative increases quickly. In order to avoid these error rates, marketers generally follow traditional research advice: wait until you have more data to get more clarity on statistical significance.
But waiting until closer to the end of a campaign limits marketers’ ability to make critical mid-flight optimization decisions. And the truth is, marketers don’t need to wait. They already have enough data to evaluate which tactics are helping campaign performance – they’ve just been stuck with the wrong tool for the job.
Outperformance Indicators
The Upwave Optimization dashboard uses a new metric called the Outperformance Indicator, which enables marketers to make optimization decisions throughout a campaign, solving the fundamental problem of having to wait for mid- or post-campaign reads. Unlike statistical significance, the Outperformance Indicator can be evaluated and acted on continuously throughout the campaign. Outperformance Indicators combine observed lift and confidence levels into a single, sortable metric that answers the optimization question: How much confidence can I have that a tactic is helping the campaign, that is, pulling up the campaign average?
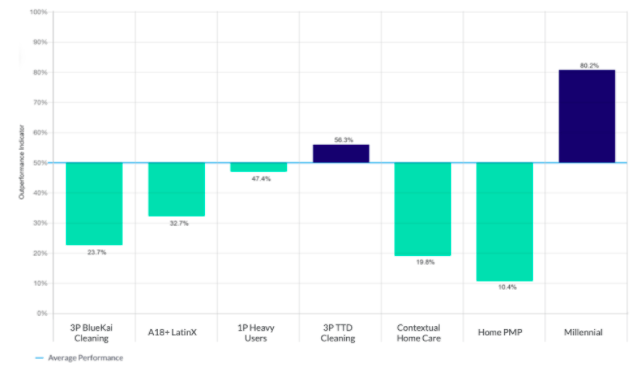
 In the example above, the audience “1P Heavy Users” has an Outperformance Indicator of 47.4%, meaning it is basically a coin toss as to whether or not continuing to target the audience will ultimately help the campaign overall. On the other hand, the audience “Millennial” has an Outperformance Indicator of 80.2%, meaning it is highly likely the audience will help the campaign but there is still a 20% chance targeting the audience will ultimately hurt the campaign.
When to Take Action
The Outperformance Indicator states the probability that a tactic will help the overall campaign. As a result, this metric is also an indicator of reliability. When a particular publisher, for example, has an 70% Outperformance Indicator that means there is a only 30% chance that continuing to advertise on that publisher for the duration of the campaign will ultimately hurt overall performance.
The natural next question is, of course, is: How soon can I start making optimization decisions based on the Outperformance Indicator? Is there a certain threshold at which the Outperformance Indicator is reliable?
The more impactful question, however, isn’t whether a tactic’s Optimization Indicator has reached a certain threshold at which point it becomes reliable, but whether the current likelihood that a tactic is helping a campaign is sufficient to make a particular optimization decision. The answer may be different depending on the decisions available.
Low Stakes vs. High Stakes Optimization Decisions
Not all optimization decisions are equal. Many optimizations, such as shifting creative rotation weights in an ad server or shifting budget between programmatic line items, are lower-stakes decisions that are best made on a regular (e.g. weekly) basis and for which a lower Outperformance Indicator can suffice (e.g. when the OI is lower than 30% or higher than 70%).
Other optimization decisions, such as removing a media partner from a media plan, are higher stakes decisions about which advertisers require a higher threshold of confidence. It likely would be unwise, for example, to cut a long-term media partner from a campaign even when the Outperformance Indicator is 20% because there’s still a 1-in-5 chance that the media partner ends up helping the campaign overall. That threshold is likely sufficient, however, to have a conversation with the media partner about the inventory being used for the campaign.
There is no hard and fast rule as to what threshold to meet for any given optimization decision. When taking action on the Outperformance Indicator, it is important to consider the relative risk of error and opportunity to gain while making continuous incremental adjustments.
Real World Application
Marketers are using the Outperformance Indicator to modify bid factors in their DSP weekly, to adjust and to have earlier conversations with media partners about performance. Publishers are using the Outperformance Indicator to optimize inventory for an advertiser throughout a campaign.
No matter the decision, the Upwave Optimization Dashboard removes the roadblock of waiting for more data, enabling marketers to look at one single, sortable metric throughout a campaign and gradually change weights or budget accordingly.
